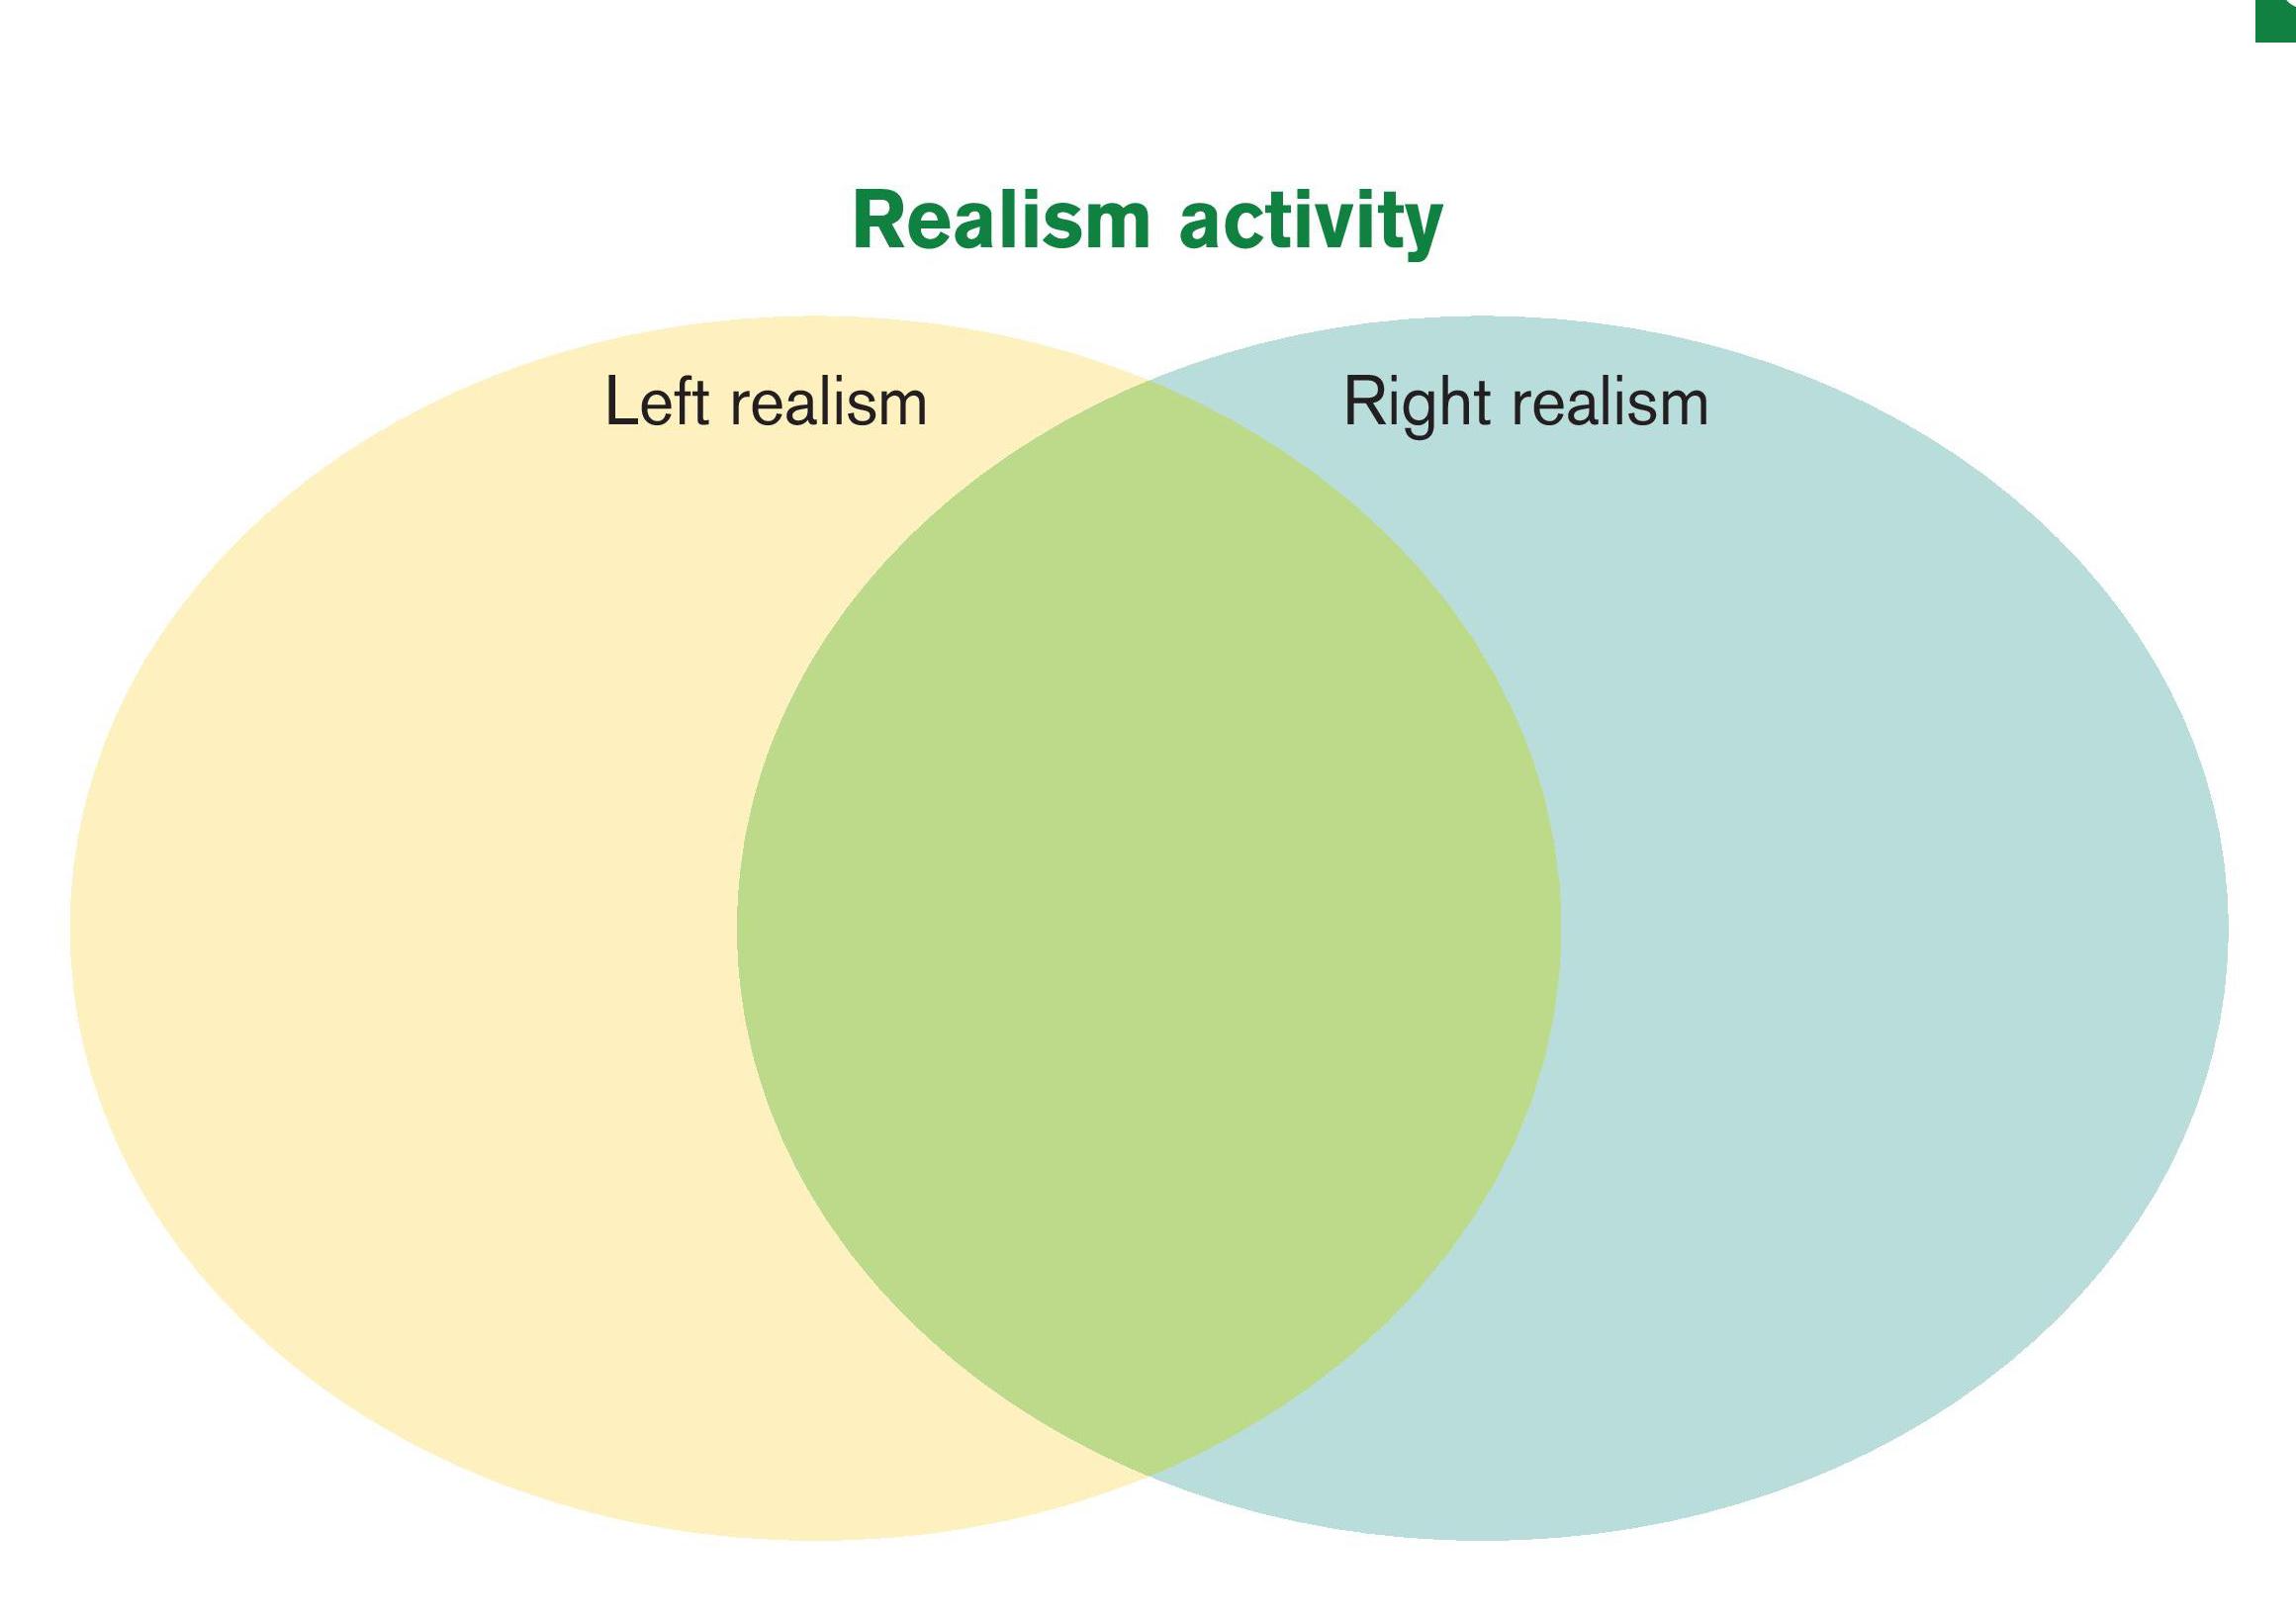
Figure 1 shows a Venn diagram of two circles with an overlapping section. One circle is headed ‘Left realism’, and the other is headed ‘Right realism’. The box below gives key points from both approaches. Read each point and decide whether it is shared by both Left and Right realism (if so, put the point in the area of overlapping circles), or whether the point is specific to either Left or Right realism (and place it in the appropriate main circle).
Figure 2 shows a suggested distribution.
Your organisation does not have access to this article.
Sign up today to give your students the edge they need to achieve their best grades with subject expertise
Subscribe


