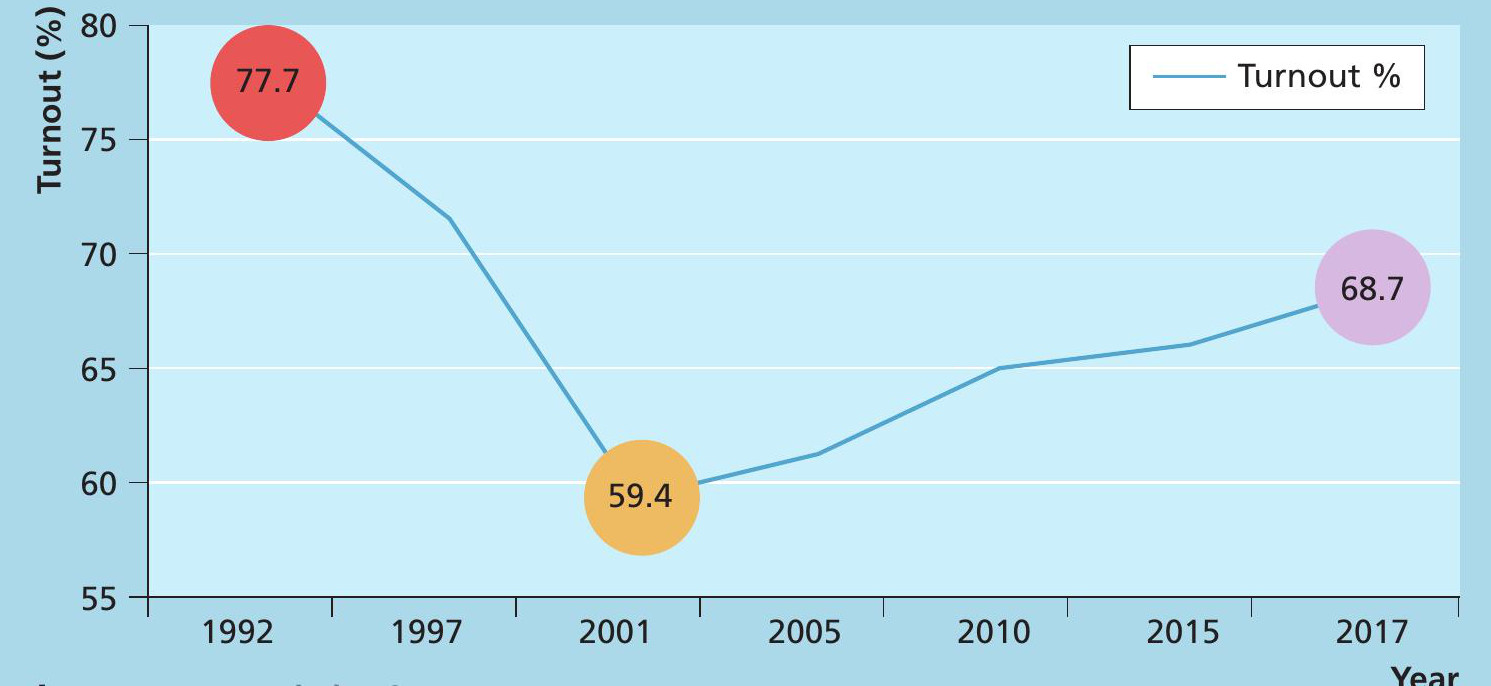
Figure 1 General election turnout, 1992–2017
At 68.7%, turnout in June 2017 increased by 2.3% to the highest level since 1997 (Figure 1). Figures 2 and 3 show that, despite the two main parties being over-represented, the June 2017 result was in line with the proportion of votes, with the notable exception of the SNP which remains dramatically over-represented due to its geographical concentration.
Figure 4 shows that both the two main parties gained at the expense of smaller parties, particularly at the expense of the UKIP vote.
Your organisation does not have access to this article.
Sign up today to give your students the edge they need to achieve their best grades with subject expertise
Subscribe


