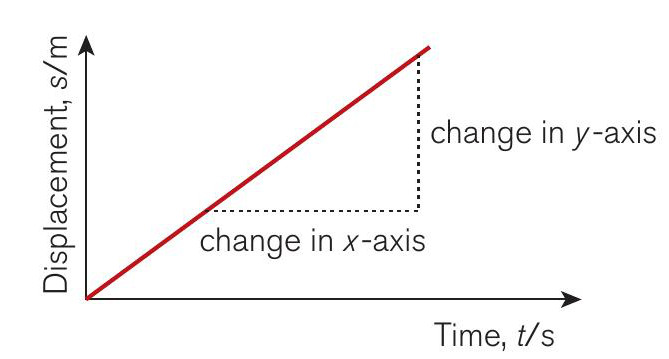
Graphs are essential tools for the physicist to use to show data or to analyse patterns and trends. You are likely to need to use graphs right from the start of your A-level physics course and this article and the Mathskit in Issue 2 will help you to see some of the ways in which graphs can be useful.
When plotting a graph from experimental data, the variable that is changed (called the independent variable) is plotted along the horizontal or x-axis, while the variable that changes as a result (called the dependent variable) is plotted on the vertical or y-axis. When explaining to another physicist the graph that has been drawn, one might say: ‘I drew a graph of displacement against time.’ This means displacement on the y-axis and time on the x-axis, as in Figure 1. Note that the axes must always be labelled with the quantity (e.g. displacement) and the unit (e.g. m). The normal way of doing this is shown in Figure 1. When measuring how a quantity changes with time, time is almost always the independent variable.
Your organisation does not have access to this article.
Sign up today to give your students the edge they need to achieve their best grades with subject expertise
Subscribe


