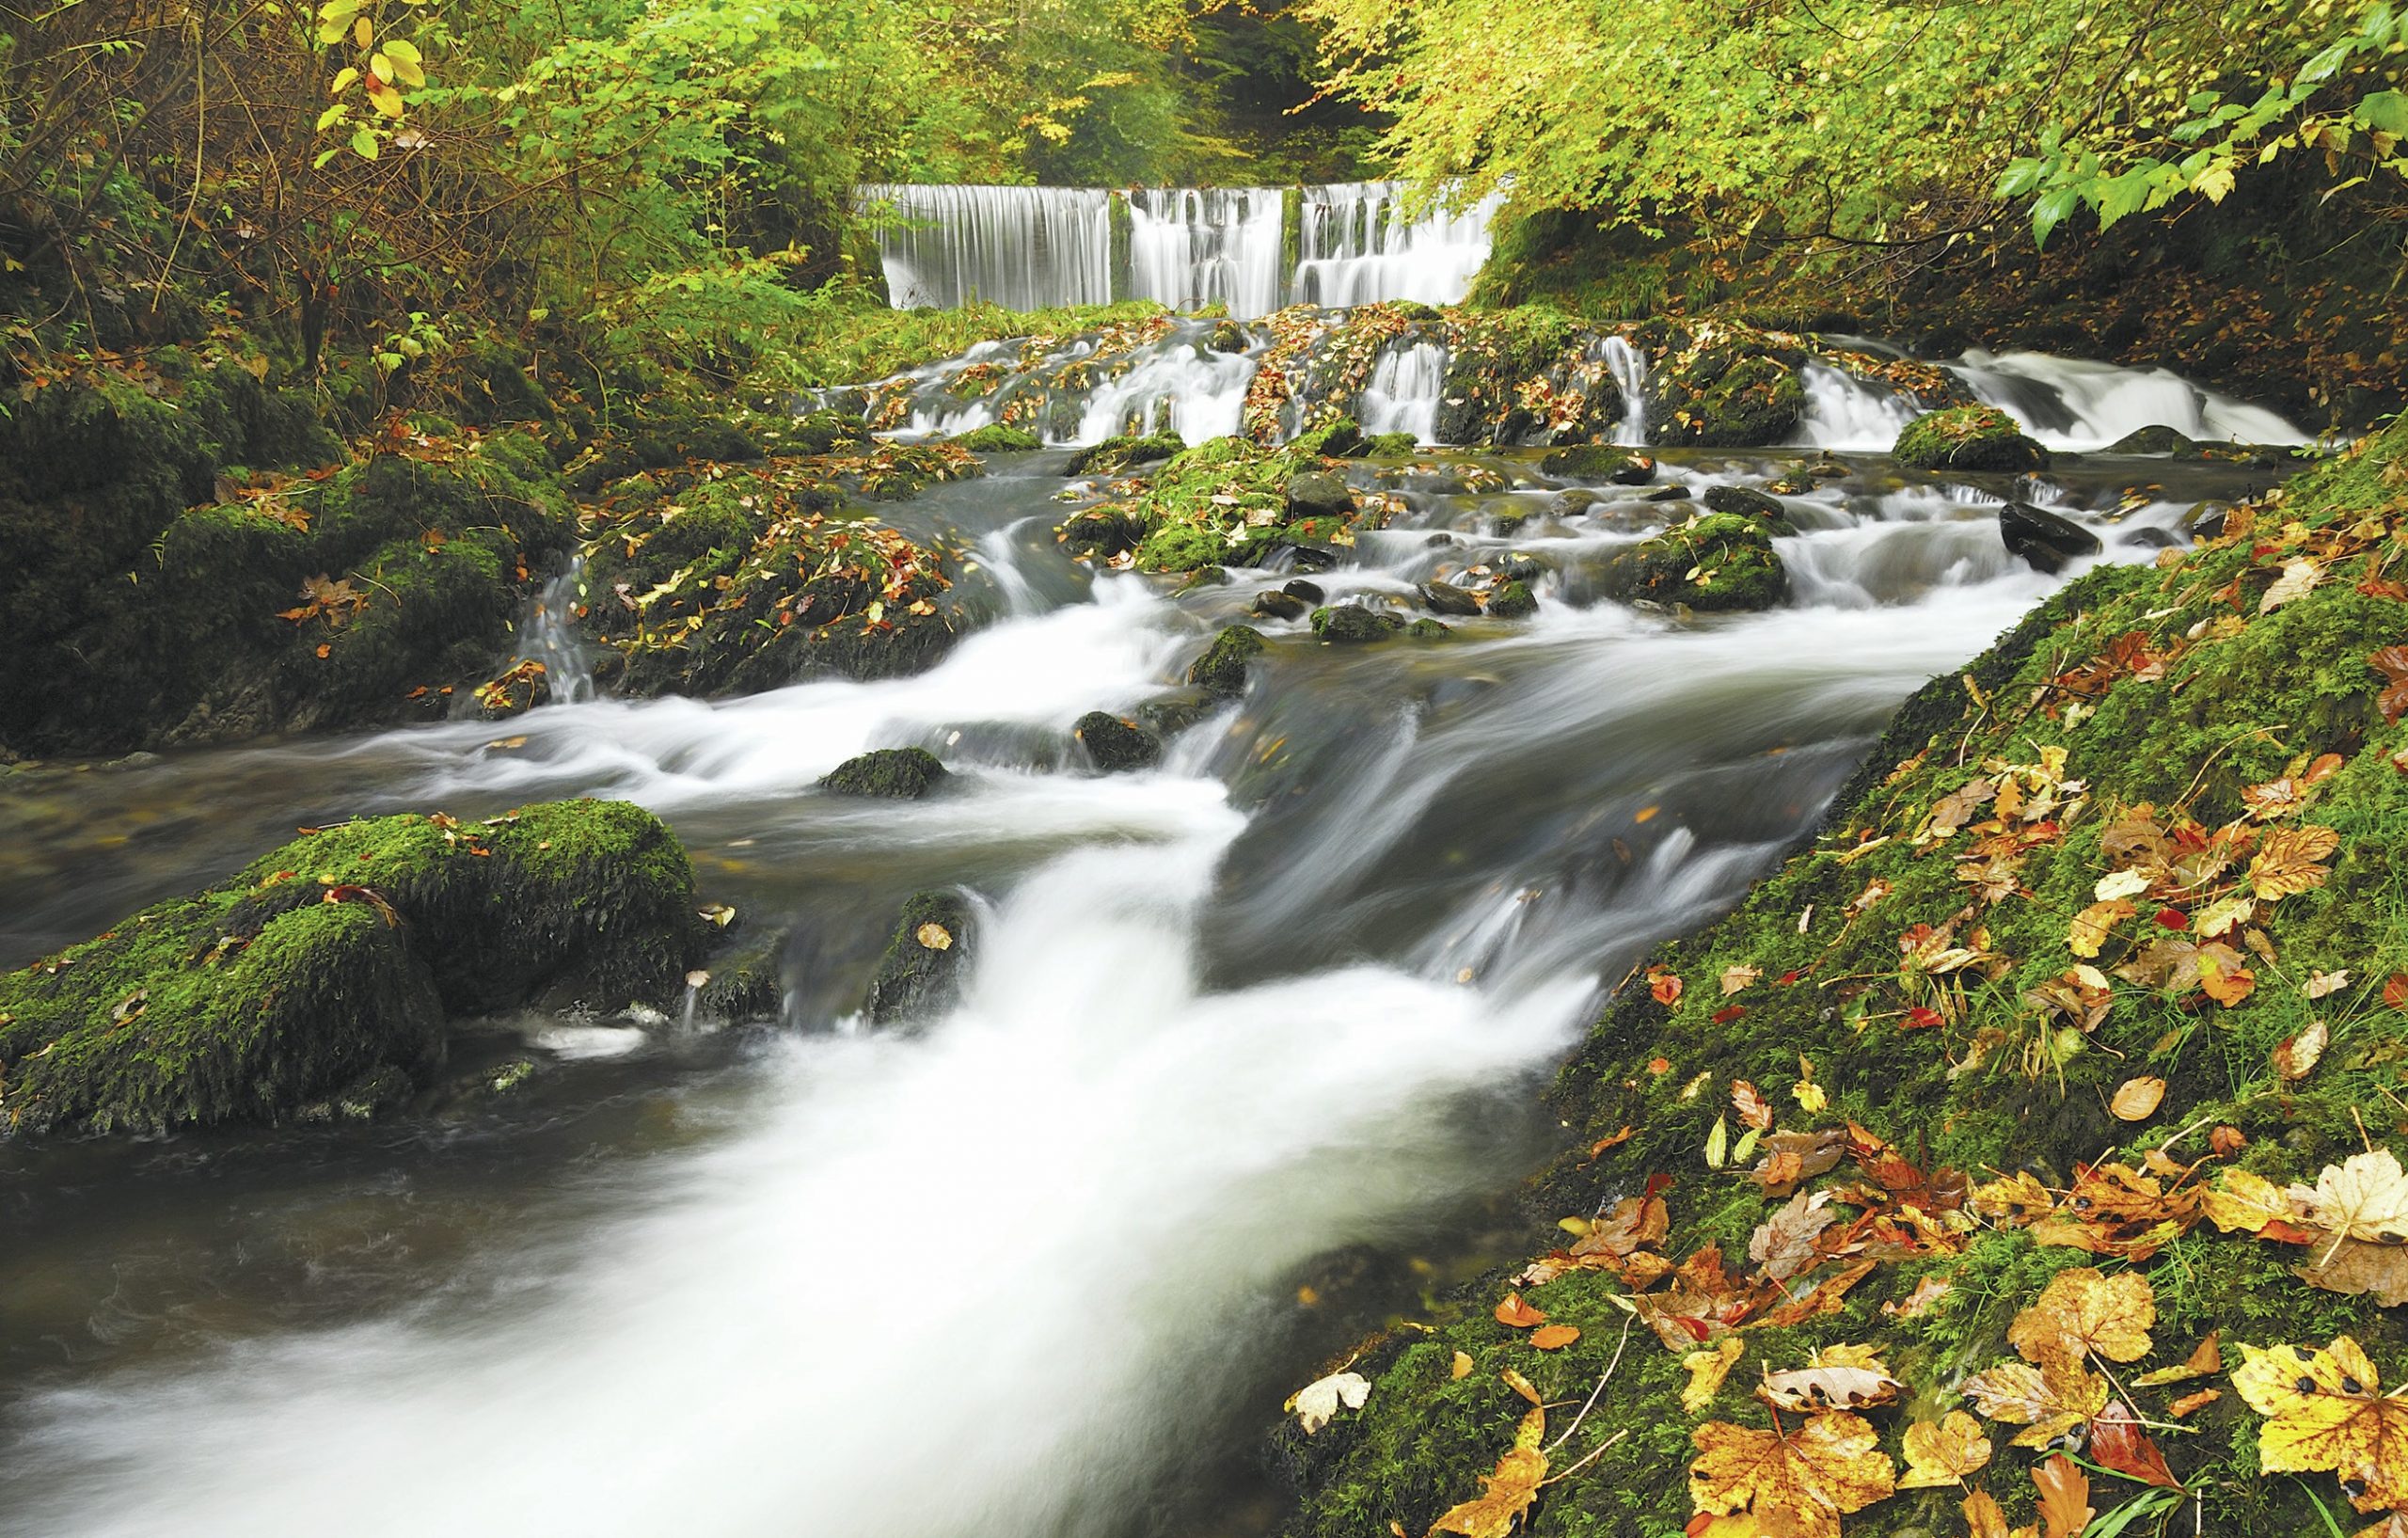
All A-level geography students know that rivers perform three key tasks: erosion, transportation and deposition. The Hjulström curve, developed by Swedish geographer Filip Hjulström, is a graphical representation of the relationship between these processes, the size of sediment in the river and a river’s velocity.
At AS you may get ‘stand alone’ questions about the Hjulström curve, or you may be asked to apply your understanding of the curve to river processes and the formation of different landforms. This Building on the Basics explains how the graph is constructed and interpreted and gives some examples of how the Hjulström curve can be useful in understanding river behaviour and landforms.
Your organisation does not have access to this article.
Sign up today to give your students the edge they need to achieve their best grades with subject expertise
Subscribe
