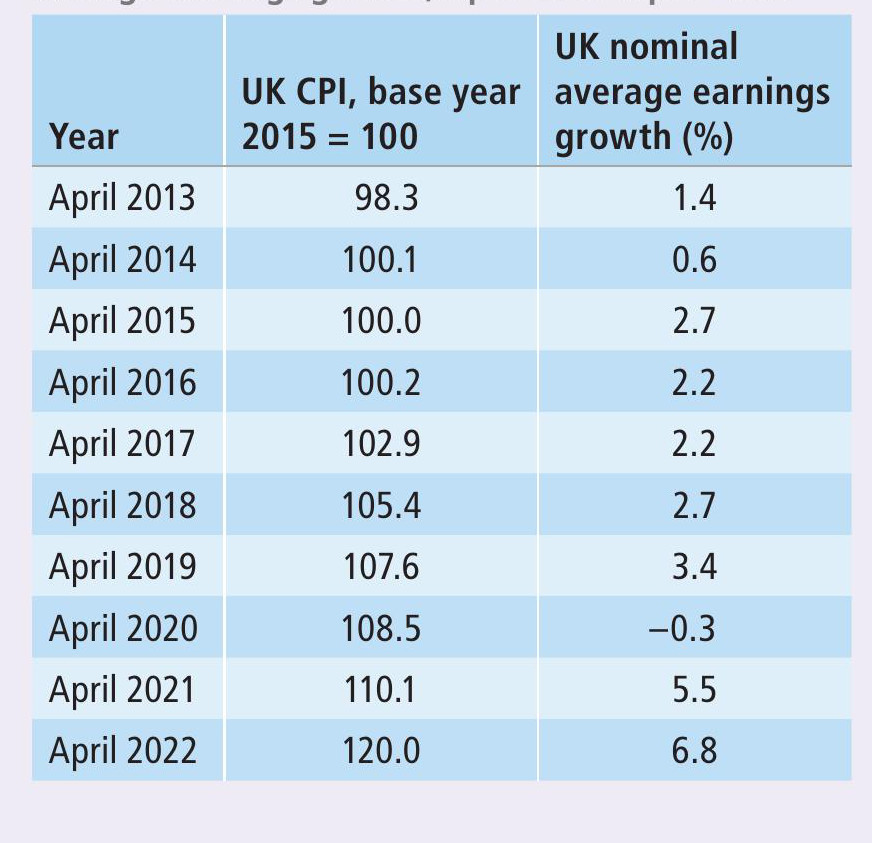
Table 1 UK Consumer Price Index (CPI) and nominal average earnings growth, April 2013–April 2022
1 Using the data in Table 1, calculate the rate of inflation in the UK between April 2013 and April 2022. Give your answer to one decimal place. (2 marks)
2 Explain how the data in Table 1 may show that living standards in the UK have fallen between 2013 and 2022. (4 marks)
Your organisation does not have access to this article.
Sign up today to give your students the edge they need to achieve their best grades with subject expertise
Subscribe


