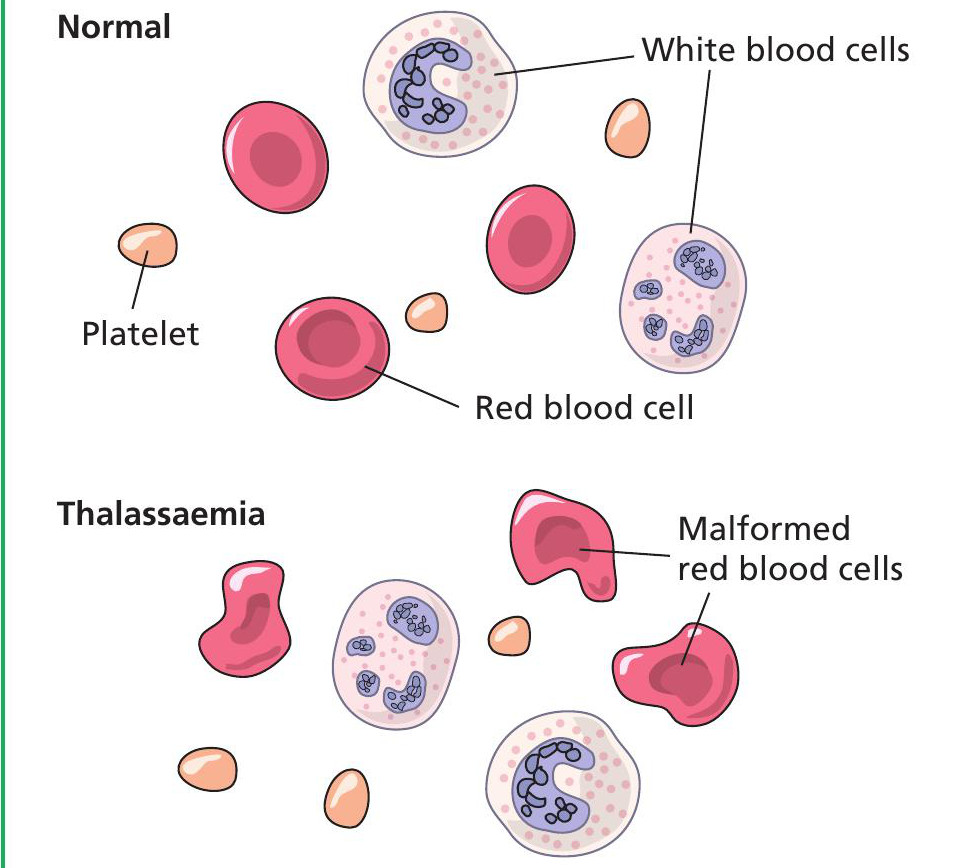
Figure 1.1 Normal red blood cells compared with those affected by thalassaemia
Hardy-Weinberg equation
Gene
Your organisation does not have access to this article.
Sign up today to give your students the edge they need to achieve their best grades with subject expertise
Subscribe


